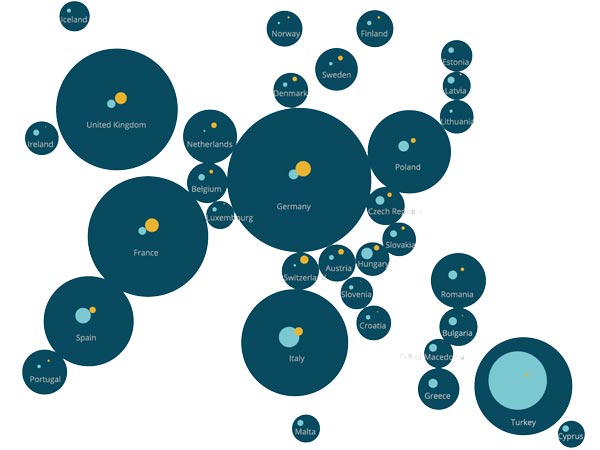
Infographic Traffic in Europe


The graphic shows the modal split data of transport in the European countries and their impact. The project has been developed during a course at SUPSI Lugano in collaboration with Pignataro and F. Maina.
Web application Infographic →
- Data visualization
- Web application