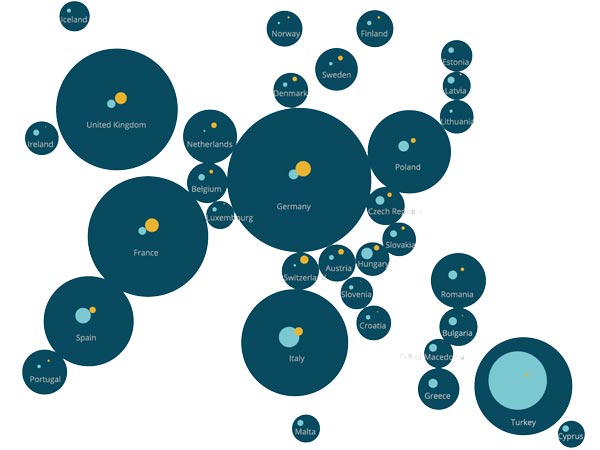
Data Visualization Summer in the city
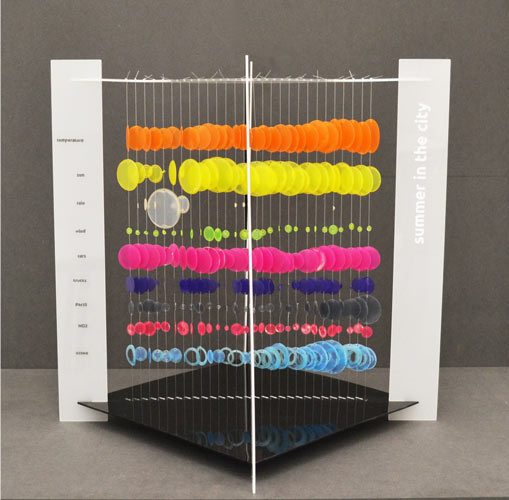
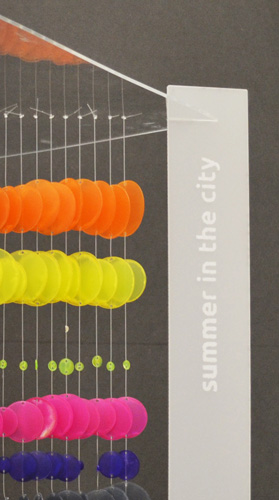
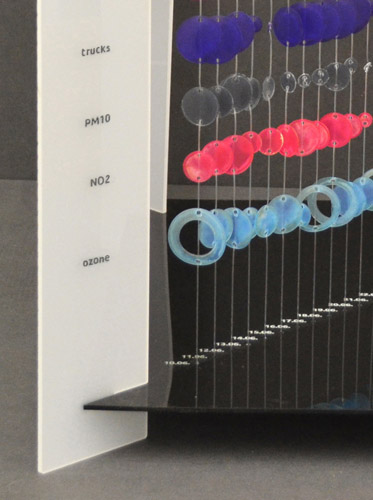
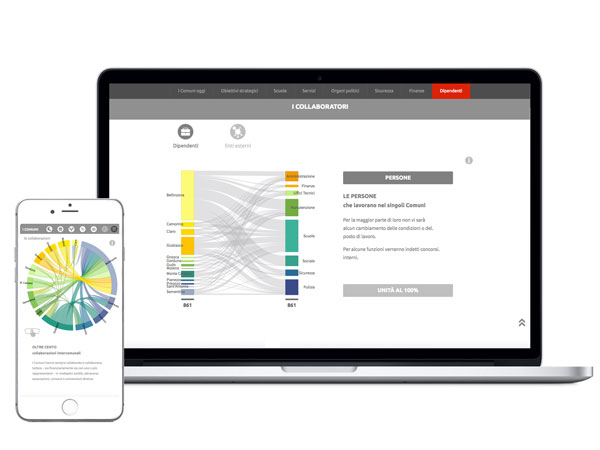
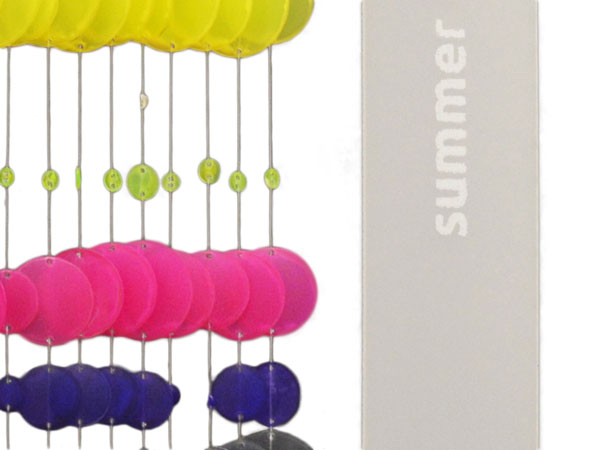
The physical installation with an associated web application illustrates the influence of weather and traffic volume on the data of air pollution during a 4-week period in the summer of 2015 in Lugano. The project was developed and realized during a workshop at SUPSI Lugano.
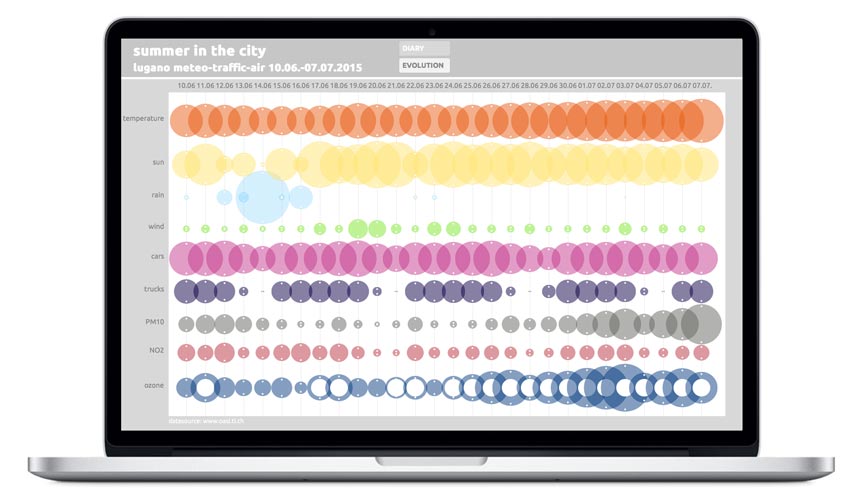
Web application Summer in the city →
Data source: oasi.ti.ch →
- Data visualization
- Web application