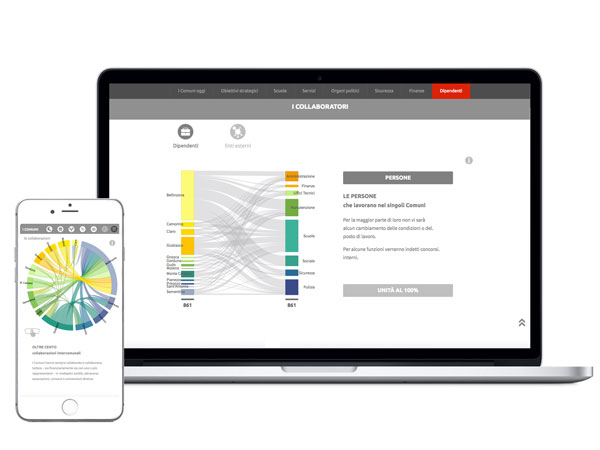
Data Visualization and Infographic FusionViz


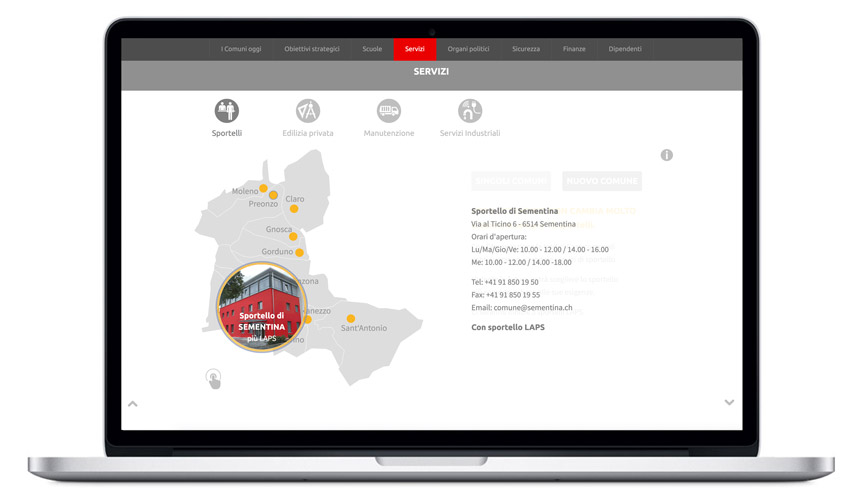

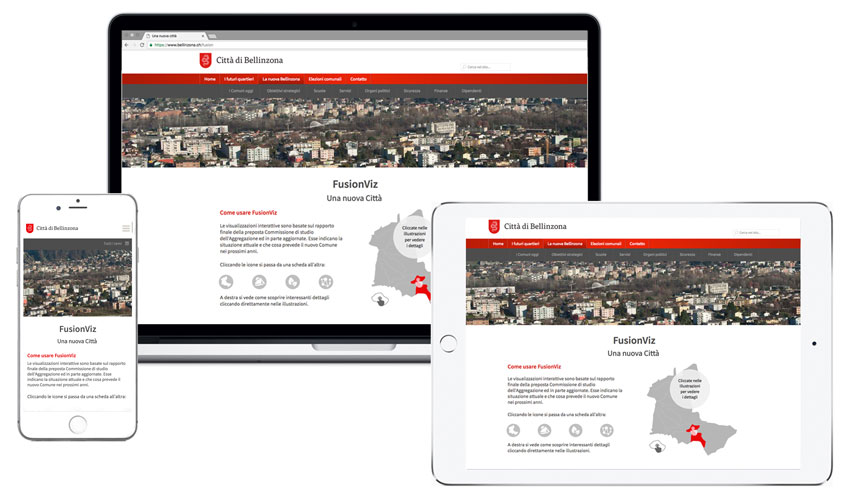
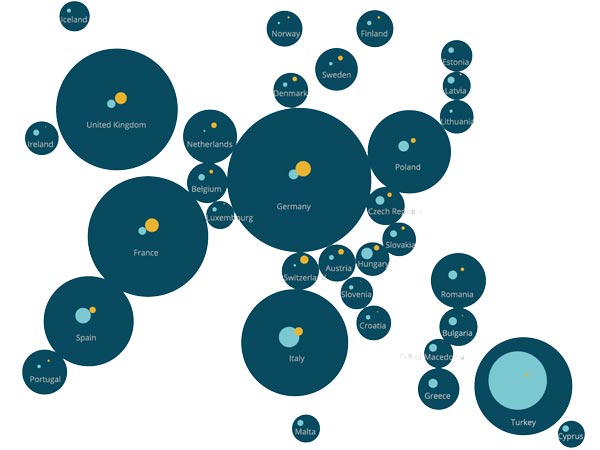
The graphical visualizations of the data and projects for a planned municipality fusion are, in contrast to the theoretical report, quick and easy to understand. This helps the population to inform themselves about the planned changes and to form an opinion for the vote. Even after the voting, the visualizations illustrate the upcoming transformations in a clear way. The basic project was created as a master thesis in the Interaction Design course and was further developed and published for the merger of 13 municipalities of Bellinzona, Ticino.
Web application FusionViz →
- Data visualization
- Infographics
- Web application